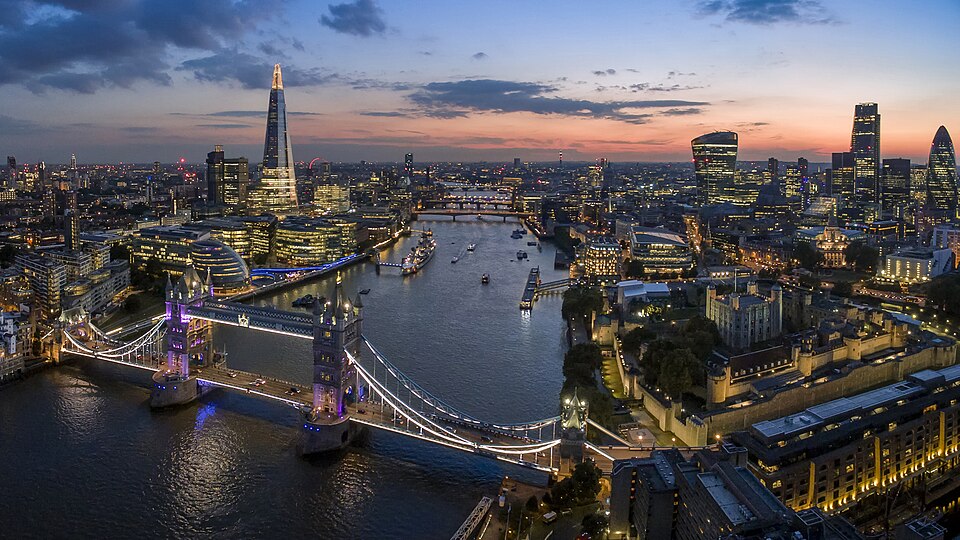
United Kingdom property prices

UK property prices by city: London, Bristol, Edinburgh, Manchester, Birmingham, Leeds, Glasgow, Liverpool (2026)

Short answer. In 2025 to early 2026, the highest selling prices were in London (about 8,106 EUR per square meter) and the lowest in Liverpool (about 2,779 EUR per square meter), a gap of about 192%. These are sold (transaction) prices per square meter in pounds converted to euros. Source: HM Land Registry and ONS sold-price data (via Plumplot and Registers of Scotland), converted from pounds to euros at the live rate.

Updated 8 June 2026Official source named

Buying in United Kingdom?

See the homes that fit you through a vetted local agent. Free, and no spam.

Talk to a local agent

Where these places are

Full data table

UK property prices by city: London, Bristol, Edinburgh, Manchester, Birmingham, Leeds, Glasgow, Liverpool (2026). Prices in EUR per square meter.
CitySelling (EUR/sqm)Sold (EUR/sqm)Change, 12 monthsTrend
London8,106n/a-2.7%Cooling
Bristol4,400n/a-2.6%Stable
Edinburgh4,358n/a+4%Stable
Manchester3,590n/a+0%Stable
Birmingham3,590n/a+3.3%Stable
Leeds3,590n/a+3.3%Stable
Glasgow2,953n/a+5.2%Rising
Liverpool2,779n/a+9.1%Rising

Source: HM Land Registry and ONS sold-price data (via Plumplot and Registers of Scotland), converted from pounds to euros at the live rate. https://www.gov.uk/government/collections/uk-house-price-index-reports

Official trend

United Kingdom's real (inflation adjusted) BIS residential property price index fell about 0.9% over the year to 2025-Q4, with the index at 110.5 (2010 = 100). This is the official trend behind the asking prices above. Source: BIS (Bank for International Settlements), fetched 2026-06-09. https://data.bis.org/topics/RPP

How we know these numbers

The UK's official trend comes from the ONS and HM Land Registry UK House Price Index. The UK left the EU so it is no longer in Eurostat, but it is in the BIS dataset, which this page uses for the trend line. The per square meter figures here are sold (transaction) prices from Land Registry data, given in pounds and converted to euros automatically at the live rate.

These are sold (transaction) prices per square meter from Land Registry data, in pounds and converted to euros automatically. London is in a league of its own; the northern cities are far cheaper and several are still rising. The official trend comes from the ONS, HM Land Registry and the BIS dataset.

Frequently asked questions

Which UK city is most expensive per square meter?

London by a wide margin, around 7,000 pounds per square meter, more than double the big northern cities. Bristol and Edinburgh come next.

Where are UK house prices rising or falling?

London and Bristol eased a little over the year, while Liverpool, Glasgow and the northern cities rose. Liverpool was the fastest riser at about 9 percent.

Are these asking or sold prices?

These are sold (transaction) prices per square meter from Land Registry data, not listing prices. The official trend comes from the ONS, HM Land Registry and the BIS dataset.

Sources